
Gambling has negative average return
In mainstream media and movies investing is often compared to gambling. A bunch of angry people in suits yelling “BUY!” and “SELL!” at a computer screen, hoping for the best – much like playing the roulette. If you examine the way a roulette (or any other casino game for that matter) is designed though, you will quickly notice the odds are again you. By the law of large numbers, the more you play, the more certain it is you will lose. In fact, the outcome is so certain, there is a precise number you will lose 1/37 or 2.7% of every dollar you bet, regardless of whether you play red/black, thirds, a number, or any other combination. It is almost like a negative interest rate. You effectively have to pay for the pleasure of participating in the game. Investing is exactly the opposite. On average you expect a positive return, and the more you diversify and the longer you invest for, the law of large numbers makes it increasingly likely you receive exactly your expected return. And the best part is, you get paid a premium on top of your expected return for agreeing to play the game in the first place.
Investing has positive average value and a premium on top for taking a risk
Let’s look at an example. Imagine there are two investment opportunities in the world: a Bank deposit and a Stock. The Bank deposit has a guaranteed return of 5%, so if we invest $100 today we will get $105 in a year. The stock does not have a guaranteed return, but let’s assume we can estimate that it will be worth $100, or $105, or $110 with a probability of 1/3 each. Now the expected return of the stock is then 105, exactly the same as the Bank Deposit. So what should the price of the stock be?
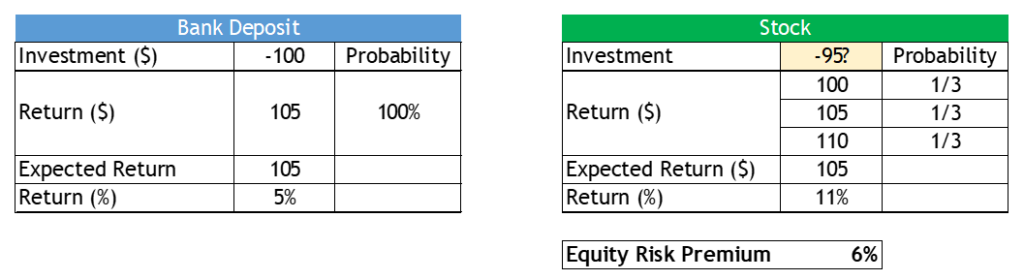
The obvious answer would be $100. If the Stock has the same expected return as the Bank deposit ($105), it should have the same initial value. If people were risk-neutral that would be exactly right. However, people are risk-averse, on average. If they can get $105 for sure or $105 on average, but with some risk (both to the upside and to the downside), they will choose the safer option. Therefore, to incentivize people to buy stocks at all, the Stock price needs to be below $100; something like $95, as we have assumed in this case. Therefore, if you choose to invest in the Stock your expected return is 11% (105/95 -1), or 6% on top of the risk-free return of 5%. This is what we call equity risk premium. You expect to get the same value as the bank deposit ($105) on average, but because you accept some variability in your earnings, you get to earn an extra return of 6% on top. Remember, playing roulette, you get to lose 2.7% on every dollar on average.
Now this was just an example with numbers I made up, but it is reflective of how markets work and very much in line with historical experience. The historical expected market risk premium in the US has been around 5% over the last 20 years (see chart below).
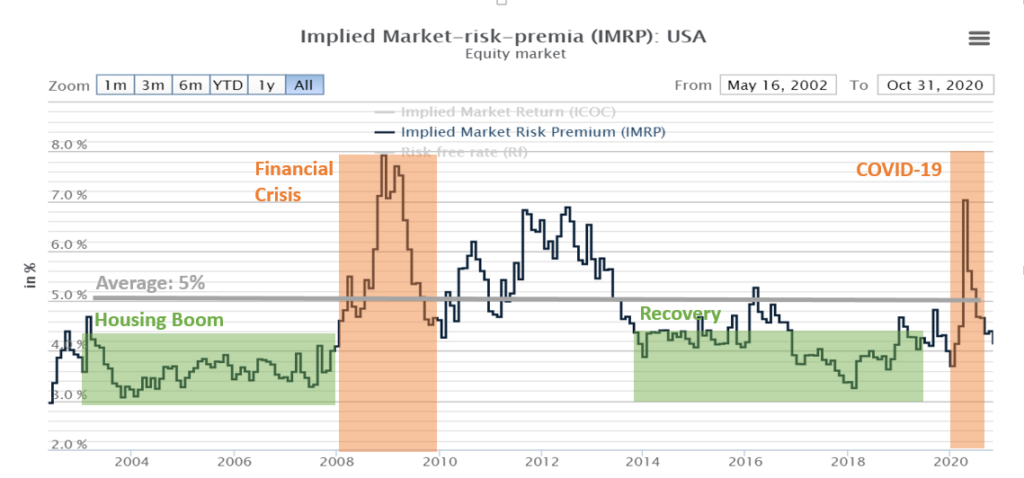
You will also notice that the risk premium is not fixed over time but it moves. This is no accident. As we discussed, the market risk premium is the compensation investors require over the secure return they can get in the bank. In times of crisis (2008, 2020), investors require much more return to take on risk. When times are good (2004-2007), (2014-2018), investors are a lot more optimistic and require less compensation to take on risk. The risk premium is always positive though, which means a market will always price stocks in a way that provides you with an expected bonus on top of what you can get at the bank.
But what if the price of my stock goes down?
In the example above, the three possible outcomes for the Stock prices ($100, $105, $110) were always bigger than the initial investment ($95), and we knew exactly how likely each of these outcomes was – 1/3. In reality stock prices routinely go up and down, and it is not obvious to the average person what the probability of each outcome is. Luckily scholars have figured that out for us. Returns of broad baskets of stocks, like the S&P500 for example, very much approximate something called a normal distribution (see chart below).
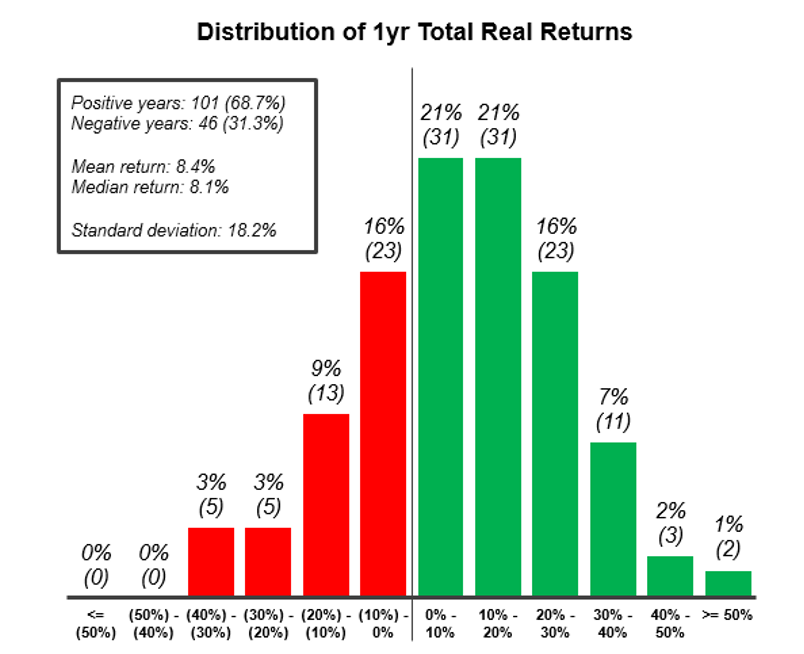
The x-axis shows show possible annual returns over the last 150 years from -50% to +50% per year. The height of the bars represents how often any particular return occurred. The middle values are high, which means they occurred fairly often, the values at the two ends (called tails) are low, meaning those values occur very infrequently.
So in aggregate how have stocks behaved over the last 150 years?
- The S&P 500 had an average total return of 8.4% per year. Note, this is more than the expected 5% average risk premium, we discussed above. The total return is the sum of the risk-free bank rate (which must have been 3.4% on average) and the equity risk premium, which is around 5%. In essence, if your money stayed in the bank you would have realized 3.4%, because you took on some risk, you got rewarded with an extra 5%, for an 8.4% total.
- There were twice as many positive years (69%) as negative years (31%).
- The tails are roughly symmetrical, with a slight skew to the right (positive) meaning the bigger swings have more often been positive than negative. Historically 0% of years have seen more than 40% drop in stock prices, but 3% of years have seen more than 40% increase in stock prices.
- The tails are low (have low frequency) meaning, extremely good outcomes like a +45% gain or -45% loss are incredibly rate.
Now, it is important to remember that the above does not mean every single stock will always make you money all of the time. What it means though is that if you invest in a diversified portfolio and can afford to be invested for a number of years, you are expected to earn well above what a bank can offer you.
One thought on “Why Investing Creates Value (and Gambling Doesn’t)”
Comments are closed.